
New plugin release! Create interactive charts and diagrams in Joomla/WordPress/YOOtheme Pro with DJ-Charts
New plugin release! Are you seeking a solution to craft interactive charts and diagrams directly on your Joomla or WordPress-powered website? With DJ-Charts, effortlessly generate charts and diagrams within the Joomla/WordPress and YOOtheme Pro builder.
What is DJ-Charts plugin?
DJ-Charts empowers you to craft visually captivating charts and graphs with minimal effort. Whether you're illustrating intricate data trends, displaying statistical data, or enhancing your website's visual appeal, DJ-Charts provides an intuitive interface and comprehensive customization capabilities to realize your vision. Bid farewell to cumbersome manual charting procedures and unlock your website's full potential with DJ-Charts.
Supported chart types
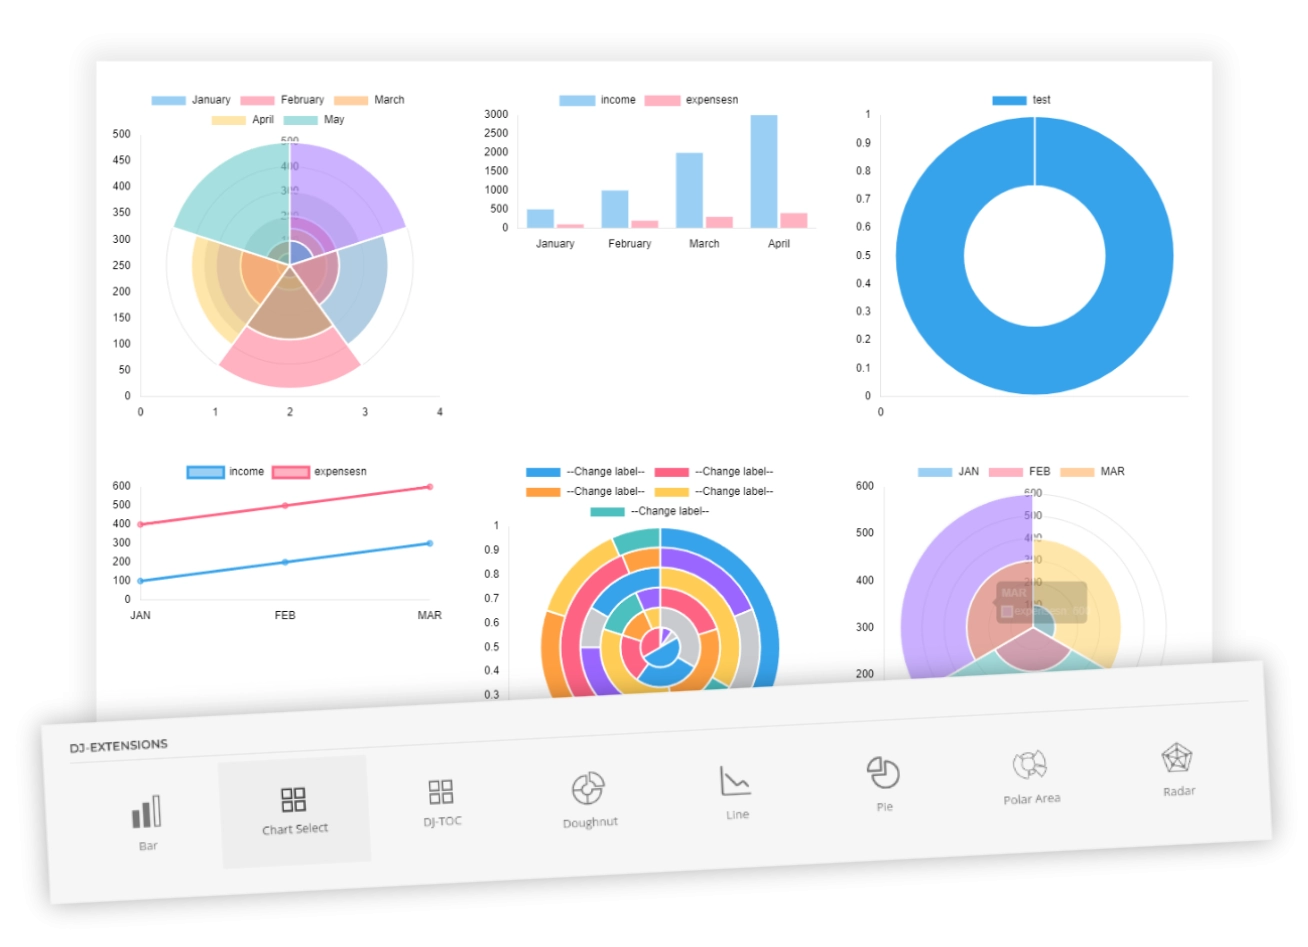
Our generator plugin comes with 6 different chart types supported:
- Bar - Chart that presents categorical data with rectangular bars with heights or lengths proportional to the values that they represent.
- Doughnut - Pie chart with its center cut out to look like a donut.
- Line - Is a way of plotting data points on a line. Often, it is used to show trend data, or the comparison of two data sets.
- Pie - Circular statistical graphic which is divided into slices to illustrate numerical proportion.
- Polar area - similar to pie charts, but each segment has the same angle - the radius of the segment differs depending on the value.
- Radar - Displays multivariate data stacked at an axis with the same central point. The chart features three or more quantitative variables for comparison; these variables are known as radii.
Various ways of adding data
The chart generator comes with three ways of adding data:
- Previously prepared charts
- Creating a new chart
- Improting data from a CSV file
This content comes from the DJ-Extensions blog post: